PSYC FPX 4700 Assessment 1 Basics of Research and Statistics Frequency Distributions Percentiles and Graphical Representations
Student Name
Capella University
PSYC FPX 4700 Statistics for the Behavioral Sciences
Prof. Name:
Date
Basics of Research and Statistics, Frequency Distributions, Percentiles, and Graphical Representations
Complete the following problems within this Word document. Do not submit other files. Show your work for problem sets that require calculations. Ensure that your answer to each problem is clearly visible. You may want to highlight your answer or use a different font color to set it apart.
Problem Set 1.1: Identifying Variables (Dependent, Independent, Quasi-Independent)
Criterion: Identify dependent and independent variables.
Instructions: For the following examples, identify the dependent variable and independent (or quasi-independent) variable.
A researcher tests whether cocaine use increases impulsive behavior in a sample of cocaine-dependent and cocaine-inexperienced mice. Independent Variable: Cocaine Quasi-Independent Variable: Mouse type Dependent Variable: Impulsive behavior
A professor tests whether students perform better on a multiple-choice or fill-in-the-blank test format. Independent Variable: Testing format Quasi-Independent Variable: N/A Dependent Variable: Student performance
A researcher tests whether smoking by parents influences children’s attitudes toward smoking behavior. Independent Variable: Parental smoking habits Quasi-Independent Variable: N/A Dependent Variable: Attitude towards smoking
A social scientist tests whether attitudes toward morality differ based on political affiliation (Democrat or Republican). Independent Variable: Political affiliation (Democrat/Republican) Quasi-Independent Variable: N/A Dependent Variable: Attitude towards morality
A cultural researcher tests whether individuals from different cultures share or differ in the belief that dreams have meaning. Independent Variable: Culture Quasi-Independent Variable: N/A Dependent Variable: Beliefs about dreams having meaning
Problem Set 1.2: Understanding Sample and Population
Criterion: Describe the relationship between population and sample.
Instructions: Read the following and answer the question.
Height and educational attainment: Szklarska et al. (2007) hypothesized that taller young men are more likely to move up the scale of educational attainment compared with shorter individuals from the same social background. They recruited 91,373 nineteen-year-old men to participate in the study.
Do these participants most likely represent a sample or population? Explain. The participants represent a sample, as the study focuses on a specific group (taller young men) and not the entire population of young men.
Problem Set 1.3: Create a Dataset for Use in JASP
Criterion: Enter and display data for use in JASP. Data: Five social media users spent the following number of minutes viewing Twitter: 15.21, 46.18, 12.45, 65.486, 26.852.
Instructions: Use the provided data to complete the steps below.
- Open Excel.
- In cell A1, type “Minutes.” The variable of Minutes is continuous.
- In cells A2-A6, enter the provided data in the column labeled Minutes.
- Save your dataset as a .csv file.
- Open JASP.
- In the sandwich menu, scroll down to OPEN, then select COMPUTER. Locate your .csv file and click it to open it.
- Take a screenshot of your data in JASP and paste it below.
Problem Set 1.4.a: Grouped or Ungrouped
Criterion: Explain the identification of types of data.
Instruction: Fill in the table below. For each example, state whether it is grouped or ungrouped and why.
| Example | Grouped or Ungrouped | Why |
|---|---|---|
| The time (in seconds) it takes 100 children to complete a cognitive skills game. | Grouped data | Data is presented in the time it takes to complete a task (frequency) |
| The number of single mothers with 1, 2, 3, or 4 children. | Ungrouped data | Data is presented in individual points, not in groups. |
| The number of teenagers who have experimented with smoking (yes, no). | Ungrouped data | Data is nominal, only yes/no, not grouped. |
| The age (in years) of freshman students in a local college. | Ungrouped data | Data is individual, ages are not grouped. |
Problem Set 1.4.b: Understanding Descriptive and Inferential Statistics
Criterion: Explain the identification of types of data.
Instructions: Read the following and answer the question.
Gun ownership in the United States: Data from Gallup polls over a 40-year period show how gun ownership in the United States has changed. The results are described in the table below, with the percentage of Americans who own guns given in each of 5 decades:
| Year | % |
|---|---|
| 1972 | 43 |
| 1982 | 42 |
| 1992 | 48 |
| 2002 | 40 |
| 2012 | 43 |
Source: Reported at http://www.gallup.com/poll/1645/Guns.aspx
Are the percentages reported here an example of descriptive statistics or inferential statistics?
- Descriptive statistics, as it describes the main features of the dataset.
Based on the percentages given in the table, how has gun ownership in the United States changed over the past 40 years?
- The percentage of gun ownership has fluctuated over the past 40 years but has remained within a narrow range of 40%-48%.
Problem Set 1.5: Reading a Chart
Criterion: Locate data on a chart.
Instructions: Read the following and answer the questions.
Participant Characteristics
| Profession | Type Count | Token Count |
|---|---|---|
| College Professor | 24,541 | 878,261 |
| Clinical Psychologist | 23,617 | 751,188 |
| Unknown | 479 | 927 |
| Total | 1,630,376 |
Do college professors or clinical psychologists in this sample speak more words overall (Token Count)?
- College professors speak more (878,261) compared to clinical psychologists (751,188).
Do college professors or clinical psychologists in this sample speak more different words (Type Count)?
- College professors use more different words (24,541) compared to clinical psychologists (23,617).
Problem Set 1.6: Frequencies and Percentages
Criterion: Identify frequencies and percentages.
Instructions: State whether a cumulative frequency, relative frequency, relative percent, cumulative relative frequency, or cumulative percent is most appropriate for describing the following situations. For cumulative distributions, indicate whether these should be summarized from the top down or from the bottom up.
Data:
- The frequency of businesses with at least 20 employees: Cumulative frequency
- The frequency of college students with less than a 3.0 GPA: Cumulative frequency
- The percentage of women completing 1, 2, 3, or 4 tasks simultaneously: Relative percent
- The proportion of pregnancies delivered in public or private hospitals: Relative frequency
- The percentage of alcoholics with more than 2 years of substance abuse: Cumulative percent
Problem Set 1.7: Understanding Percentages
Criterion: Identify distribution type and number of people.
Instructions: Read the following and answer the questions.
Perceptions of same-sex marriage: In June 2016, a CBS News poll asked a sample of adults worldwide whether it should be legal or not legal for same-sex couples to marry (reported at http://www.pollingreport.com). The opinions of adults worldwide were as follows: 58%, legal; 33%, not legal; and 9%, unsure/no answer.
What type of distribution is this?
- Binomial distribution
Knowing that 1,280 adults were polled nationwide, how many Americans polled felt that same-sex couples should be allowed to legally marry?
- Roughly 742 adults
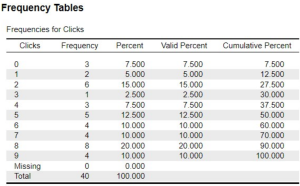
Problem Set 1.8: Create an Ascending Frequency Table in JASP
Criterion: Create an ascending frequency table in JASP.
Data: Use dataset clicks.jasp. This dataset is a record of the number of clicks per hour in forty different tweets.
Instructions: Complete the steps below.
- Download clicks.jasp. Double-click the icon to open the dataset in JASP.
- In the Toolbar, click Descriptives.
- Select Clicks and then click Arrow to send it over to the Variables box.
- Click Tables. In the menu that opens, check Frequency Tables.
- Copy and paste the ascending values frequency table into the Word document. Note: You will continue to use this dataset in the next two problems.
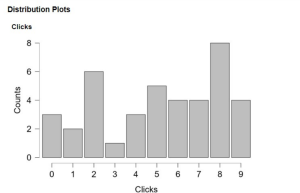
Problem Set 1.9: Construct a Bar Graph in JASP
Criterion: Construct a bar graph in JASP. Data: Use dataset clicks.jasp. This dataset is a record of the number of clicks per hour in forty different tweets.
Instructions: Complete the following steps to create a bar chart to examine the data:
- Download clicks.jasp. Double-click the icon to open the dataset in JASP.
- In the Toolbar, click Descriptives.
- Select Clicks and then click Arrow to send it over to the Variables box.
- Click Basic Plots, then check Distribution Plots.
- Copy and Paste the bar graph below.
- Optional to answer: What is the shape of the distribution?
Note: You will continue to use this dataset for the next problem.

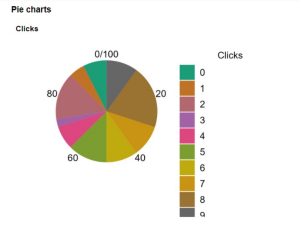
Problem Set 1.10: Construct a Pie Chart in JASP
Criterion: Construct a pie chart in JASP. Data: Use dataset clicks.jasp.
Instructions: Complete the following steps to create a pie chart.
1. Download clicks.jasp. Double-click the icon to open the dataset in JASP.
2. In the Toolbar, click Descriptives. 8 D
3. Select Clicks and then click Arrow to send it over to the Variables box.
4. Click Basic Plots, then check Pie charts.
5. Copy and paste the pie graph below.