

PSY FPX 7864 Assessment 2 Correlation Application and Interpretation
Student Name
Capella University
PSY FPX 7864 Quantitative Design and Analysis
Prof. Name:
Date
Data Analysis Plan
This assignment involved conducting a correlation analysis between variables from the grades.sav file. The variables analyzed included gender, GPA, total, and final scores. For each of the six pairings (gender/final, gender/GPA, gender/total, final/GPA, final/total, and GPA/total), the null hypothesis stated that there is no relationship between these variables, while the alternative hypothesis suggested that there is some relationship. The research question was: Is there a relationship between final scores and GPA? In this context, GPA served as the independent variable, final scores as the dependent variable, gender as a nominal variable, and GPA, final, and total scores as ratio variables. The sample size (N) was 105, and the alpha level was set at .05. Given the nature of the variables and the research question, correlation was an appropriate statistical test.
Testing Assumption
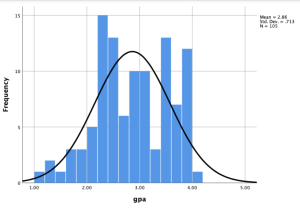
The assumptions for testing the correlation between GPA and final scores included the dependence of the variables. Additionally, the assumption was that both x and y are quantitative variables with a normal distribution. The histogram presented demonstrates the frequency distribution of GPA, revealing a slightly positively skewed normal curve. The kurtosis appears to be normal as well, with a platykurtic distribution indicated by a less sharp curve. The mean GPA was 2.86, with a standard deviation of .713.
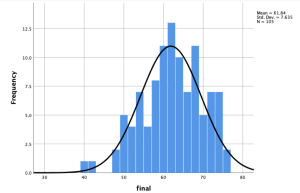
The histogram for the final scores displayed a negatively skewed distribution, with a leptokurtic distribution, indicating a sharper peak. The mean final score was 61.84, with a standard deviation of 7.63.
Descriptive Statistics
| N | Minimum | Maximum | Mean | Std. Deviation | Skewness | Kurtosis | |||
|---|---|---|---|---|---|---|---|---|---|
| gpa | 105 | 1.08 | 4.00 | 2.8622 | .71266 | -.220 | .236 | -.688 | .467 |
| final | 105 | 40 | 75 | 61.84 | 7.635 | -.341 | .236 | -.277 | .467 |
The descriptive statistics table above displays the skewness and kurtosis values for both GPA and final scores. The skewness for GPA was -.220, and the kurtosis was -.688. For final scores, the skewness was -.341, and the kurtosis was -.277. The GPA and final scores were approximately symmetric since the skewness for both variables fell between -1 and 1.
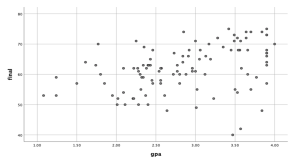
The scatter plot displayed GPA on the horizontal axis and final scores on the vertical axis, illustrating the relationship between these two variables. The scatter plot indicates a moderate linear relationship between GPA and final scores, with a moderate positive correlation between the final grade and GPA. Outliers were observed between GPA values of 3.4 and 3.6, as well as between 1.2 and 1.3.
Results & Interpretation
The intercorrelation matrix displayed the lowest magnitude correlation between GPA and gender, with a negative correlation coefficient of -.193, a p-value of .048, and a degree of freedom of 103. The effect size was 105. Since the p-value (.048) was greater than the alpha value of 0.05, we do not reject the null hypothesis, indicating no significant relationship between GPA and gender.
The highest magnitude correlation was observed between the final and total scores, with a strong positive correlation coefficient of r = .875, a p-value of .000, and a degree of freedom of 103. Given the data and the alpha value of 0.05, the null hypothesis was rejected, and the alternative hypothesis was accepted, suggesting an association between final and total scores.
The correlation between GPA and final scores showed a positive correlation coefficient of r = .379, a p-value of .000, and a degree of freedom of 103. As the p-value was less than the alpha value of 0.05, the null hypothesis was rejected, and the alternative hypothesis was accepted, indicating a significant correlation between final scores and GPA.
| Correlations | gender | gpa | total | final | |
|---|---|---|---|---|---|
| gender | Pearson Correlation | 1 | -.193* | -.113 | -.111 |
| Sig. (2-tailed) | .048 | .250 | .258 | ||
| N | 105 | 105 | 105 | 105 | |
| gpa | Pearson Correlation | -.193* | 1 | .318** | .379** |
| Sig. (2-tailed) | .048 | .001 | .000 | ||
| N | 105 | 105 | 105 | 105 | |
| total | Pearson Correlation | -.113 | .318** | 1 | .875** |
| Sig. (2-tailed) | .250 | .001 | .000 | ||
| N | 105 | 105 | 105 | 105 | |
| final | Pearson Correlation | -.111 | .379** | .875** | 1 |
| Sig. (2-tailed) | .258 | .000 | .000 | ||
| N | 105 | 105 | 105 | 105 |
PSY FPX 7864 Assessment 2 Correlation Application and Interpretation
- Correlation is significant at the 0.05 level (2-tailed).
- Correlation is significant at the 0.01 level (2-tailed).
Statistical Conclusions
Based on the analysis of the data, it can be concluded that there is a relationship between GPA and final scores. This type of analysis provided insight into how these two variables are related. However, it is important to note that correlation does not imply causation, and the relationship between variables may not apply to every individual. Additionally, the test may have limitations, such as the fairness of the exam not reflecting the material covered in the course. Future research could explore the relationship between final scores and the amount of time students spend studying for the exam.
Application
This type of analysis is particularly useful in the field of Applied Behavior Analysis (ABA), as it is data-driven. In ABA, data is collected on clients’ behaviors and programs, allowing for the tracking of progress and making necessary adjustments to intervention plans. Utilizing histograms can provide parents with a visual representation of their child’s progress. This type of analysis adds value to the presentation and interpretation of data.