

PSY FPX 7864 Assessment 4 Data Analysis & Application
Student Name
Capella University
PSY FPX 7864 Quantitative Design and Analysis
Prof. Name:
Date
Section 1: Data Analysis Plan
This analysis will utilize data from the grades.sav file, focusing on four variables: QUIZ1, GPA, TOTAL, and FINAL. All these variables are continuous, meaning they can take on an infinite number of values between the lowest and highest points, rather than being confined to a finite number of groups. There are two research questions for this study. The first question aims to determine if there is a correlation between the total points earned in class (TOTAL) and the number of correct answers on the final exam (FINAL). The null hypothesis posits that there is no correlation between the TOTAL and FINAL variables, while the alternative hypothesis suggests that a relationship exists between these two variables. The second research question seeks to find out if there is a correlation between the number of correct answers on the first quiz (QUIZ1) and the previous grade point average (GPA). The null hypothesis for this question states that there is no correlation between the QUIZ1 and GPA variables, whereas the alternative hypothesis indicates that a relationship exists between QUIZ1 and GPA.
Section 2: Testing Assumptions
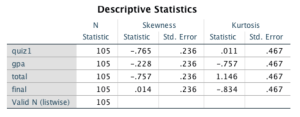
To assess normality, a descriptive statistics table was created that included the four variables relevant to the research questions. For the QUIZ1 variable, the skewness is -.765, while the skewness for the GPA variable is -.228. The skewness for the TOTAL variable is -.757, and for the FINAL variable, it is .014. All these statistics are favorable concerning normality, as they fall within the range of -1 to +1 (Capella, 2021). The kurtosis statistics also align with normality expectations. The kurtosis for QUIZ1 is .011, for GPA it is -.757, for TOTAL it is 1.146, and for FINAL it is -.834. The ideal range for normality is achieved for QUIZ1, GPA, and FINAL, while the TOTAL statistic remains within the acceptable range of -2 to +2 (Capella, 2021). These statistics collectively indicate that the assumptions of normality have been satisfied.
Section 3: Results & Interpretation
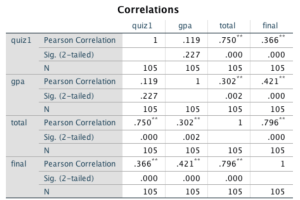
According to the correlation matrix, the TOTAL-FINAL correlation is r(103) = .796, p = .001. This is based on the degrees of freedom calculated as (N-2), or 105-2 (103), with the Pearson correlation coefficient being .796 and the probability value (p) being .000, which is rounded to .001 from the significance (2-tailed) value shown. Since the p-value is < .05, the null hypothesis is rejected, indicating a statistically significant correlation.
For the second pair of variables, QUIZ1 and GPA, the correlation is r(103) = .119, p = .227. This is similarly established by the degrees of freedom (N-2), or 105-2 (103), with the Pearson correlation coefficient being .119 and the probability value (p) being .227. This statistic does not reject the null hypothesis, as it is > .05, indicating that there is no statistically significant correlation.
Section 4: Statistical Conclusions
Upon reviewing the statistical results, one pair of variables rejects the null hypothesis while the other does not. The TOTAL-FINAL correlation has a p-value of < .05, leading to the rejection of the null hypothesis and confirming a statistical relationship. Conversely, the QUIZ1-GPA variable pair resulted in a p-value > .05, failing to reject the null hypothesis, which supports the conclusion of no significant correlation.
PSY FPX 7864 Assessment 4 Data Analysis & Application
In addition to the small sample size, limitations of this analysis may include external variables that could influence correlation results, such as time spent studying, class attendance, and participation rates.
Application
As I am currently studying Educational Psychology, I intend to focus on pediatric anxiety, particularly within school settings during early childhood. Two variables that could be analyzed for correlation are the number of hours young children spend in daycare and the frequency of incidents involving internalized or externalized behaviors.